Simulation of the layout of a helicopter hangar


During a conversation about the airfield, I hear “Is it possible to optimize the storage of the helicopter hangar? Can we add storage or a new machine without disturbing the existing one? Measures should be taken.” I continue with a very concrete proposal to test a classic use case: the optimization of space. I propose to digitize the hangar, to extract the plans and to give access to all the measurements to make simulations. If the results are positive for this small hangar of 500 m2, this use case can easily be applied to other hangars or workshops on the platform.
The Company Helisair Operates several helicopters that are stored in a hangar. The North-West Face of It, is equipped with large sliding doors allowing an opening over almost the entire width. Inside, on each side, racks are used to store goods and tools for routine machine maintenance.
The preparation
We decided to use a mobile scanner to quickly cover this small area. We used the laser scanner NavVis M6. It takes about 10 minutes to assemble the scanner stored in 4 cases and to do the first calibrations. We quickly discuss the operating conditions and opt for “closed doors” scanning to perfectly cover the limits of the hangar and materialize the doors. The light conditions are not exceptional but sufficient to capture photos. In addition to 3D data, we'll be recording HD panoramic photos along the trajectory. The setting chosen is a 360° photo every 2 meters.
We discuss the optimal trajectory to follow in order to capture the entire area. The challenge is to allow the 3 lidars (laser sensors) to “see everything” while promoting “buckle closures” (Loop Closure in English) that limit, or even eliminate, the localization drift that accumulates over time for this type of equipment. The quality of the endpoint cloud depends directly on the experience and the path chosen during the capture. On the other hand, optimization is important to limit the volume of data captured, you just need what you need, no more. Too redundant data clutters storage servers and penalizes post-processing and use.
Digitization
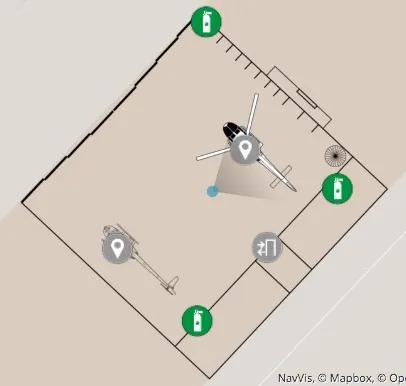
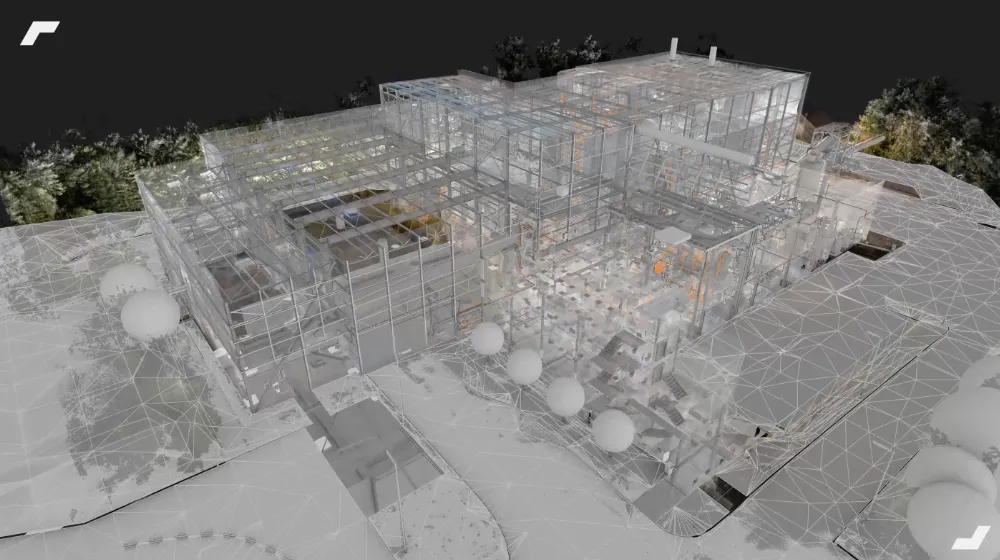
It only took 15 minutes to cover the 500 m2 of the hangar with the trajectory shown in the image below. This image is a 2D projection of the 3D point cloud. The red dots indicate where the panoramic photos were taken. There are points beyond the limits of the hangar, the doors not being contiguous, the laser beams have captured a small part of the outside.

This capture therefore allowed:
- to obtain a global point cloud, at once, with a density of 5 mm (distance between two points in the cloud)
- to take 68 panoramic photos
This raw data represents 3 GB in total.
A post-processing phase (filtering and improving the point cloud, building panoramic views from the photos of the 6 cameras) was necessary to make the initial data usable. The processing time on one of our servers was approximately 2 hours to obtain the global point cloud at maximum density and the 360° photos assembled.
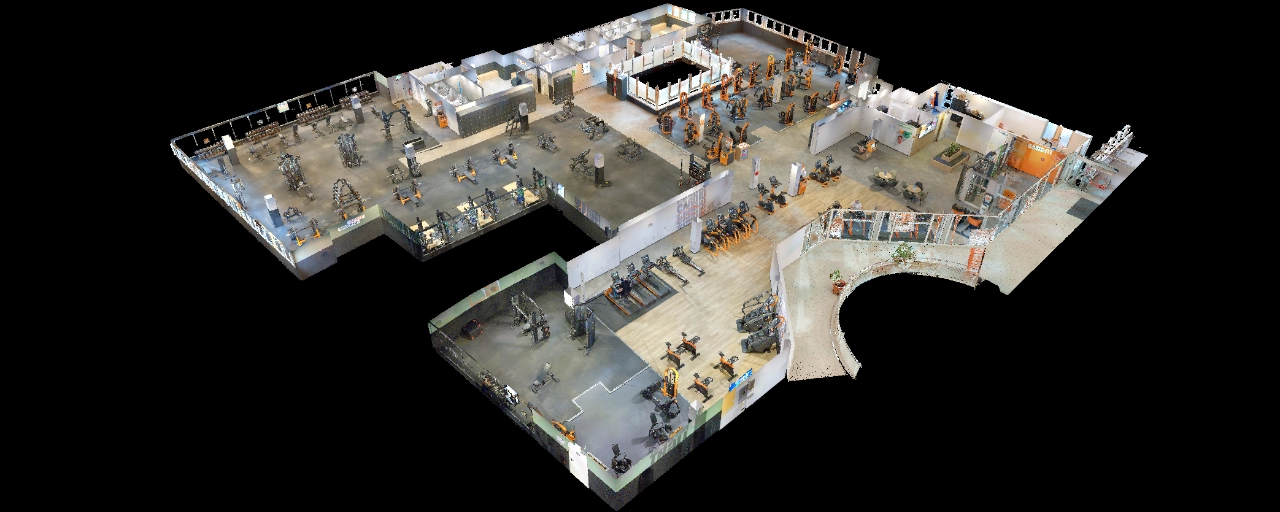
The virtual visit
A data optimization phase was necessary to lighten them and give them good properties so that they could be loaded and viewed in a web browser. It lasted about 30 minutes on our servers.
You can test the virtual tour below. You will visualize the points of interest both on the 2D plane and in the photorealistic view. To find fire extinguishers, entering “ext” in the search bar at the top left allows you to get a list of them.
2D plans
The most effective manual method for extracting the 2D plane of the area is to use a point cloud manipulation tool to take a horizontal “slice” from the area in the right place. On this “metric” basis and after a few treatments to refine the line, the contours are redrawn with an architecture-oriented CAD drawing software. We then export in a DXF or DWG vector format. A modelled plan has been reintegrated into the virtual tour accessible in the window at the bottom right. This plan appears on a basemap that also shows the situation of the building on a more global scale.
The 3D model
As with 2D plans, it is possible to “redraw” a 3D model over the point cloud that has been captured. Many tools incorporate advanced options to detect shapes and replace them with 3D objects, the best known are Autodesk Revit or AutoCAD, Trimble RealWorks or SketchUp, Dassault Système SolidWorks or Catia, Rhino3D, etc. This work requires more time than for 2D plans and is only done if the use absolutely requires it. An order of magnitude of the cost of 3D modeling buildings is between 0.50 and 2.00€ per m2 (depending on the surface, the type and the required precision).
The simulation
Once the metric base has been established through 2D plans or directly in a 3D model (not mandatory), it is possible to import this data into CAD software and simulate a new layout or test new locations for the machines.
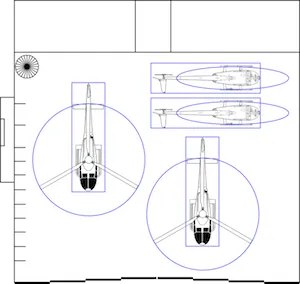
In the case of this hangar, the approach from the 2D plane was adopted and the work was only done from the ground. Given the height of the buildings and the objects to be stored, there is little chance of a collision with the ceiling. For example, by integrating the 2D framing boxes (blue lines below) for the fuselage as for the rotor, it is possible to move the elements and optimize the space. In this hangar, for example, you can double the machine storage and upgrade to two R44s and two EC120s.
Conclusion
Whether for an aeronautical hangar or more generally for industrial warehousing or storage, it is important to optimize space. It is a question of cost, organization and productivity all at the same time. This simple and pragmatic case describes a 2D approach to simulate different organizations of space using accessible tools. Beyond these simulations, 3D data (point clouds) can be used by the owner and his architect (or the design office or the general contractor) to quantify work. The virtual tour can also be used to promote the company and its activity.
To find out more, discover:
Let's study your project together
Contact us, we will study your project to provide you with an estimate as soon as possible
Contact us


To make sure you don't miss out on our news, subscribe to our newsletter now!
Receive quarterly updates directly in your inbox to stay informed about the latest news and events at My Digital Buildings.


